
On this page 8 sections

A cotton candy machine works in a bowling alley when it stands where families wait: behind the lane seating, by the party room or on the way out. The 18 alleys among the open marketplace listings cited below take 30% to 40% of net sales; the 16 with counts report a median of 50,000 visitors a year.
At a glance
| Factor | Bowling alleys |
|---|---|
| Typical traffic | Median 50,000 visitors a year across the 16 listed alleys that report a count (10,400 to 250,000); venue-reported, not audited |
| Venue share | 40% of net sales at 11 alleys, 35% at one, 30% at six; none at 50% |
| Who signs | The owner or general manager at an independent center; head office at a chain |
| Best spot inside | Behind the lane seating, beside the party area or on the path out, clear of the snack bar |
| Season | Year-round, strongest in winter; federal payroll data puts the low in July and August |
| Verdict | A strong first venue, if the center books birthday parties and fills on weekends |
Source: PinPoint Vending’s marketplace, whose 87 open listings on October 5, 2026 include 18 bowling alleys.
How many visitors does a bowling alley bring a cotton candy machine?
A bowling alley brings a cotton candy machine a median of 50,000 visitors a year, going by the 16 alleys in the marketplace listings that report a count. The range runs from 10,400 in Hillsboro, Illinois, to 250,000 in Tyngsborough, Massachusetts, and the middle eight alleys report 30,000 to 75,000. Two alleys, in Clinton, Mississippi, and Defiance, Ohio, have no count.
| Bowling alley location | Visitors a year | Venue share | Tier | Signed |
|---|---|---|---|---|
| Tyngsborough, MA | 250,000 | 30% | Premium | Jul 2026 |
| Peru, IL | 100,000 | 40% | Premium | Jul 2026 |
| Pittsburgh, PA | 100,000 | 30% | Premium | Jul 2026 |
| Toronto, OH | 75,000 | 40% | Standard | Aug 2026 |
| Winsted, CT | 75,000 | 40% | Standard | Aug 2026 |
| Fort Smith, AR | 70,000 | 40% | Standard | Jul 2026 |
| Bucyrus, OH | 50,000 | 40% | Standard | Jul 2026 |
| Greensburg, PA | 50,000 | 40% | Standard | Jul 2026 |
| Platteville, WI | 50,000 | 40% | Standard | Jul 2026 |
| Green Bay, WI | 40,000 | 30% | Standard | Aug 2026 |
| Yucca Valley, CA | 35,000 | 40% | Standard | Jul 2026 |
| Shenandoah, VA | 30,000 | 30% | Standard | Jun 2026 |
| Ithaca, MI | 25,000 | 35% | Standard | Jul 2026 |
| Barnesville, OH | 20,000 | 40% | Standard | Jul 2026 |
| Marcellus, NY | 20,000 | 30% | Standard | Aug 2026 |
| Hillsboro, IL | 10,400 | 30% | Standard | Jul 2026 |
| Clinton, MS | Not counted | 40% | Standard | Jul 2026 |
| Defiance, OH | Not counted | 40% | Standard | Jul 2026 |
The counts are the venues’ own and are not audited, so treat each one as the manager’s estimate. The listings also convert them to a daily figure: about 140 visitors a day at 50,000 a year, and 270 at 100,000.
One large center skews the average. Tyngsborough’s 250,000 pulls the mean to about 62,500, while the median holds at 50,000, the better guide to a typical alley. The three alleys at 100,000 or more are the only Premium bowling listings, at $2,000 to enroll and $200 a month; the other 15 are Standard, at $1,000 and $100.
Ohio has four of the 18 alleys, more than any other state. Illinois, Pennsylvania and Wisconsin have two each, and eight more states have one.
What revenue share do bowling alleys take from a cotton candy machine?
Bowling alleys take 30% to 40% of a cotton candy machine’s net sales in the marketplace listings: 11 of the 18 set 40%, one set 35% and six set 30%. Net sales means sales minus a fixed $1.80 cost of goods per unit. No alley asks for 50%, a rate that in the same data comes almost entirely from stores and food sellers.
| Venue share | Alleys | Alleys with a count | Visitor range | Median visitors |
|---|---|---|---|---|
| 40% | 11 | 9 | 20,000–100,000 | 50,000 |
| 35% | 1 | 1 | 25,000 | 25,000 |
| 30% | 6 | 6 | 10,400–250,000 | 35,000 |
The 30% group holds both the smallest and the largest alley on the list, so a low share is not a small-venue discount. Across all 81 listings that set a share, 11 signed at 30%, and six of those 11 are bowling alleys. The cotton candy machine revenue share guide compares every venue type.
For the operator, the gap is real money. At $8 a serving, net sales are $6.20. Take off the venue’s share, roughly $0.50 of floss sugar and sticks and $0.48 of card processing, and a 40% share leaves the operator about $4.54 while a 30% share leaves about $5.16, a 14% raise on every serving.
We would still trade five points of share for the right spot. Moving from 35% to 40% costs 31 cents a serving, about 6% of the operator’s take; a spot behind the lane seating that sells one more serving for every 14 the concourse spot sells makes it back.
Bowling is the deepest category in the locator’s own ranking too. PinPoint Vending’s ranking of venues for a cotton candy machine places bowling alleys third behind indoor playgrounds and family entertainment centers, but calls them the largest category at 18 venues on a 50,000-visitor median, and reports all 18 asking for a cotton candy machine specifically. Depth of evidence is its own argument: more comparable alleys means a share you can benchmark.
How much can a cotton candy machine make at a bowling alley?
In our illustration, a cotton candy machine at a bowling alley clears anything from a small loss to about $1,950 a month after the placement fee, depending on the alley’s count, its share and how many visitors buy. The table runs four combinations of count, share and fee taken from the 18 listings, at two buy rates: one visitor in 100 and one in 50.
The Math (an illustration, not a forecast)
Assumptions: an $8 price; the venue’s share taken on net sales after the $1.80 cost of goods written into the listings’ host agreements; $0.50 a serving for sugar, stick and topping; card processing at 5.95% ($0.48); so the operator keeps about $4.54 at a 40% share ($8 − $2.48 − $0.50 − $0.48) and $5.16 at 30% ($8 − $1.86 − $0.50 − $0.48); visits spread evenly over 12 months; the monthly fee that matches each row’s traffic on the listings. Insurance, travel and the machine payment are left out.
| Alley profile from the listings | Visits a month | Monthly fee | 1 in 100 buys: left after fee | 1 in 50 buys: left after fee |
|---|---|---|---|---|
| 20,000 visitors, 30% share | 1,667 | $100 | −$14 | $72 |
| 50,000 visitors, 40% share | 4,167 | $100 | $89 | $279 |
| 100,000 visitors, 30% share | 8,333 | $200 | $230 | $661 |
| 250,000 visitors, 30% share | 20,833 | $200 | $876 | $1,952 |
The rows are profiles, not forecasts for the alleys behind them; no sales data comes with the listings. What the table shows is how much the count matters: at the same buy rate, the 250,000-visitor alley clears seven to 10 times what the 50,000-visitor alley does.
Your own buy rate is the unknown. Count the families who pass your spot during a busy weekend hour, and use the earnings guide for the full list of costs the table leaves out. The $8 price is an input too; our guide to what to charge per serving sets it against the snack bar’s own prices.
Who fills a bowling alley, and when?
A bowling alley fills with different crowds on different days: adult league bowlers on weeknights, families and birthday parties on weekends, and youth bowlers at set times. A cotton candy machine sells to the children in those crowds, so the weekly schedule matters more than the annual count. Ask the manager for the week’s pattern before you trust a yearly figure.
The United States Bowling Congress, the sport’s national governing body, says it serves approximately 1 million members. A league is a standing weekly booking for the same roster, so league nights bring regulars, and on an adult league night those regulars are adults.
| Session | Who comes | What it means for the machine | Ask the manager |
|---|---|---|---|
| Adult league nights | The same adult roster each week | Few children; some sales to bowlers’ families | Which nights, and how many bowlers? |
| Youth leagues and clinics | Children, with parents watching | A waiting audience every week | What day and time, and how many bowlers? |
| Birthday parties | Children and adults on a schedule | A crowd that arrives and leaves together | How many parties a week, and where are they held? |
| Weekend open bowling | Families and groups | The busiest family hours | Which hours have a wait for lanes? |
| Corporate and group events | Adults | Little | How many a month? |
The season matters too. Bowling-center payrolls, a proxy for traffic rather than a count of it, ran lower in July and August than in February in each of 2023, 2024 and 2025, according to the Bureau of Labor Statistics. The summer low ran 5% to 11% below February; in 2025, the latest full year, the series fell from 71,600 jobs in February to 68,100 in July, then climbed to 74,600 in December.
Our seasonal sales guide turns the longer series into a monthly index. A route that pairs an alley with a summer venue, such as a water park, evens out the year.
Where should a cotton candy machine go in a bowling alley?
A cotton candy machine should go behind the lane seating, beside the party area or on the path from the lanes to the exit, where families stand still with time to watch a spin. The snack bar, the bar and the shoe-rental counter are poor spots: the snack bar competes for the same dollars, the bar serves adults, and the shoe line moves too fast to watch anything.

| Spot | Verdict | Why |
|---|---|---|
| Behind the lane seating | Strong | Families wait between frames and can watch the spin |
| Beside the party room or party lanes | Strong | Children arrive in groups with an adult paying |
| On the path from the lanes to the exit | Good | Every family passes once, on the way out |
| Next to the snack bar | Weak | Competes with the center’s own food sales |
| In the bar or lounge | Weak | Adults, not children |
| At the shoe counter | Weak | The line moves too fast for a show |
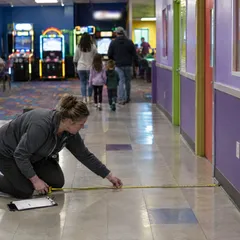
Keep the concourse open. People cross the space behind the lanes with balls, bags and children in tow, and the 2010 ADA Standards set a 36-inch minimum clear width for an accessible route (U.S. Access Board); leave that width open past both the machine and the people watching it.
Check the circuit before you choose between two good spots. Arcade games, ball returns and pinsetters all draw power in a bowling center, so ask which breaker feeds your outlet and what else it carries. The location requirements checklist lists the power, floor and climate checks in full.
Who signs for a cotton candy machine at a bowling alley?
The owner or general manager signs for a cotton candy machine at an independent bowling alley; at a chain, expect the decision to sit with the head office. Bowling center owners have their own trade group: the Bowling Proprietors’ Association of America describes itself as a nationwide network of more than 3,300 centers. If the alley sells food, the person who signs also runs the snack bar.
That snack bar is a large part of the business. Lucky Strike Entertainment, the chain formerly called Bowlero, operates more than 360 locations across North America. In the fiscal year ended June 28, 2026, it took in $431 million from food and beverage, about 35% of its $1.25 billion in revenue (Form 10-K).
Bring the alley’s own numbers to the meeting: its visitor count, its party bookings and the share you are offering, written in dollars. At $8 a serving, a 40% share pays the alley $2.48 a sale and 30% pays $1.86. A manager who also runs the snack bar will ask whether the machine takes sales from it; the pitch guide has answers for that objection.
The permit is usually the operator’s to file. Among the bowling alley listings, the license notes run from no vending license or decal in Pennsylvania to Wisconsin’s state license for food machines, at $125 a year plus $9 per machine. The cotton candy vending machine permit guide covers the health-department side state by state.
Which bowling alleys should you skip?
Skip bowling alleys whose evenings belong to adult leagues and the bar, that book few birthday parties and that sit half-empty on weekend afternoons. A cotton candy machine needs children with a parent nearby, and a center can post a big annual count without them. Skip, too, any alley that cannot give the machine its own circuit or a spot outside the walkway.
We would rather have a 30,000-visitor alley with a party room booked every Saturday than a 100,000-visitor center that runs on league nights and its lounge. The second one’s count is real; its buyers are not there.
An alley that fails on children does not end the search in that town. A cotton candy machine at an indoor playground has children in front of it every day, and a movie theater can work as a second placement on the exit side of its lobby.
Frequently asked questions
Can you put a cotton candy machine in a bowling alley?
Yes. Bowling alleys are the most common venue type among the open cotton candy marketplace listings of October 2026, 18 of 80, and the owner or general manager usually decides. Ask for a spot behind the lane seating or beside the party area rather than next to the snack bar.
What percentage do bowling alleys take from vending machines?
In the 18 bowling alley marketplace listings of October 2026, 11 venues take 40% of net sales, one takes 35% and six take 30%, where net means sales minus a fixed $1.80 cost of goods per unit. None of the alleys asks for 50%.
How many people visit a bowling alley a year?
The 16 bowling alleys in the October 2026 marketplace listings that report a count give a median of 50,000 visitors a year, from 10,400 to 250,000. The figures are the venues’ own estimates, not audited counts, so ask how a center counted before relying on one.
When are bowling alleys busiest?
Federal payroll data points to winter. From 2023 through 2025, bowling-center employment hit its low in July or August, 5% to 11% below February; in 2025 it fell from 71,600 in February to 68,100 in July, then rose to 74,600 in December. Expect a cotton candy machine in an alley to sell less in summer.
Who do you ask about putting a machine in a bowling alley?
Ask for the owner or general manager at an independent center, since that person controls the floor and, where the alley sells food, the snack bar as well. At a chain, expect the decision to sit with the head office rather than the building.
Sources
- About BPAA, Bowling Proprietors’ Association of America
- About USBC, United States Bowling Congress
- All employees, bowling centers, not seasonally adjusted (CEU7071395001), U.S. Bureau of Labor Statistics
- Form 10-K for the fiscal year ended June 28, 2026, Lucky Strike Entertainment Corporation, U.S. Securities and Exchange Commission
- 2010 ADA Standards for Accessible Design, U.S. Access Board