
On this page 9 sections

Cotton candy vending machine seasonal sales follow the venue, not the calendar. Federal payroll data, our best public proxy, shows amusement parks staffing up 46% from January to July, while bowling centers run opposite, about 9% leaner in summer than in winter. Indoor family venues sit between, so plan for a slow quarter wherever you place a machine.
When do cotton candy vending machines sell the most?
Cotton candy vending machines sell the most in whatever month their venue is busiest, and that month changes with the venue type. Amusement parks, arcades and fitness and recreation centers (the federal category that holds pools and skating rinks) all peak in July, while restaurants barely move all year. Bowling centers peak from December through March and bottom out in July.
The table turns eight years of Bureau of Labor Statistics payroll counts into a monthly index, where 100 is the venue type’s average month. A July reading of 120 means parks carry 20% more staff than in a typical month; a reading of 93 means bowling centers carry 7% fewer.
| Month | Bowling | Parks and arcades | Fitness and rec | Restaurants |
|---|---|---|---|---|
| Jan | 102 | 82 | 93 | 96 |
| Feb | 104 | 84 | 94 | 97 |
| Mar | 104 | 90 | 95 | 98 |
| Apr | 103 | 97 | 96 | 99 |
| May | 98 | 106 | 100 | 101 |
| Jun | 95 | 117 | 111 | 102 |
| Jul | 93 | 120 | 112 | 102 |
| Aug | 94 | 116 | 110 | 102 |
| Sep | 98 | 105 | 99 | 101 |
| Oct | 101 | 100 | 96 | 101 |
| Nov | 103 | 91 | 97 | 100 |
| Dec | 105 | 91 | 97 | 100 |
Source: The Sweet Spot’s calculation from BLS Current Employment Statistics, all employees, not seasonally adjusted, 2016–2019 and 2022–2025. Columns are bowling centers, amusement parks and arcades, fitness and recreational sports centers, and food services and drinking places.
Read it as a staffing curve, not a sales forecast: it shows when each venue type expects its crowds, the part of cotton candy demand you cannot change. For what a machine earns across a whole year, start with our guide to how much a cotton candy machine makes.
How can payroll data stand in for cotton candy sales?
Payroll data can stand in for cotton candy sales because venues schedule staff for the crowds they expect, and no public source publishes monthly cotton candy vending sales. The Bureau of Labor Statistics counts employees by industry every month, including an unadjusted version that keeps the seasons in. We divided each month by its year’s average, then averaged eight years of results.
The method, so you can check it or rerun it for another industry:
- Series: bowling centers, amusement parks and arcades, fitness and recreational sports centers and food services and drinking places, all employees, not seasonally adjusted.
- Years: 2016–2019 and 2022–2025. We dropped 2020 and 2021, when closures broke the normal pattern.
- Math: each month’s employment divided by that calendar year’s monthly average, averaged across the eight years, then scaled so the 12 months average 100.
Three limits matter:
- Closed parks still carry staff. A park that closes for winter keeps its year-round staff on payroll, so the index understates the true swing in sales.
- Mixed categories. The amusement series mixes theme parks with arcades.
- Pools in the fitness series. The fitness series covers gyms, pools and skating rinks under its federal industry definition, so its July peak partly reflects outdoor pools.
Once a machine has a year of sales in its app, run the same math on it: divide each month’s servings by that year’s monthly average. Your own index then replaces the payroll proxy for that venue.
Why do bowling alleys sell more in winter?
Bowling alleys are a cotton candy venue whose busy season is winter. Bowling-center payroll peaks at 105 in December, stays between 102 and 104 through March, and falls to 93 in July, the mirror image of a theme park. Summer runs about 9% leaner than winter, which makes a bowling alley a natural hedge on a route that leans on summer venues.
Weather is the likeliest reason, though the payroll data cannot prove it: families look for indoor plans from fall through early spring, and a bowling center is built for exactly that.
Bowling alleys are also the largest single venue type on PinPoint Vending’s marketplace: 18 of the 80 open listings on October 5, 2026 that specify a cotton candy machine, with a median of 50,000 visitors a year as reported by the venues, not audited. Our bowling alley venue guide covers who signs and where the machine goes.
How much do outdoor and seasonal venues swing?
Outdoor and seasonal venues swing harder than any payroll series can show. Amusement park and arcade payroll runs 37.5% higher in June through August than in December through February, and that is with year-round staff still counted in winter. A cotton candy machine at a park that closes after Labor Day sells nothing until the gates reopen.

The annual visitor figure on a listing hides this. Daily visitor numbers in the marketplace are the venue’s annual count divided by 365, so a water park in Hermitage, Tennessee, reporting 260,000 visitors a year shows as 710 a day. If that park opens about 100 days a year (an assumption; ask for the real calendar), its in-season crowd is closer to 2,600 a day.
That compression also runs into throughput. One maker lists 90 seconds per cotton candy, which caps a single machine at 40 servings an hour, or 400 across a 10-hour day. With a full sugar load rated at up to 350 servings, a peak Saturday can outrun one machine and one fill, while a February Saturday earns nothing.
Six of the 80 cotton candy listings are summer-type venues: two amusement parks, two water parks, a mini golf course and a campground. Our guide to water park placements covers when an outdoor spot can work. Ballparks run on a shorter calendar still: the cotton candy vending machine stadium guide counts about 71 home dates a year at one minor-league park.
If the machine stands outdoors without an enclosure, section 4-204.14 of the FDA Food Code calls for a self-closing door on its dispensing compartment. The rule reads the same in the 2022 edition and in the 2026 edition FDA released in September.
Do school calendars move the summer peak?
School calendars move the summer peak by about a month from region to region, because family venues get their weekday crowds only while children are out of class. Pew Research Center’s count of 2023–24 start dates found more than two-thirds of students in Alabama, Kentucky, Mississippi and Tennessee back the week of August 7. About three-quarters in New Jersey, New York and Pennsylvania started after Labor Day.
That is about four weeks of summer weekdays, based on Pew’s sample of 1,573 school districts. The gap shows up in this marketplace too: 14 of its 80 cotton candy listings sit in those four Southern states and 10 in the three Mid-Atlantic states.
A cotton candy machine at an indoor playground in Tupelo, Mississippi, should expect its summer weekday bump to end in early August. A kids center in Queens can likely count on most of August. Winter break and spring break are the other windows to watch in your machine’s sales app; no public data isolates them for vending.
Does summer humidity cut outdoor cotton candy sales?
Summer humidity cuts outdoor cotton candy sales by hurting the product before it sells. Gold Medal Products, a concession equipment maker, warns that if room humidity runs too high the cotton candy comes out too heavy. The National Weather Service describes summer dew points of 65°F and above as oppressive, the kind of air an outdoor machine can face on a July afternoon.
Air-conditioned indoor venues sidestep most of the problem, so the humidity penalty falls mainly on outdoor placements, the same ones that close for winter. Our humidity placement rules cover the thresholds and which regions need a climate-controlled spot.
How should you plan for a slow month?
Plan for a slow month by sizing fixed costs against the venue’s low month, not its average. A monthly placement fee, insurance and a card reader’s data plan do not shrink in July at a bowling alley or in January at a park. The worked example below shows one machine at two venue types, assuming its sales follow each payroll pattern exactly.
The Math
Assumptions: 300 servings in an average month (3,600 a year) at $8, with the venue taking 40% of what remains after the $1.80-per-serving cost-of-goods deduction used in the marketplace’s cotton candy listings. Materials at $0.50 a serving (one maker’s figure) and 5.95% card fees leave $4.54 a serving. Fixed costs are $150 a month on a Standard location: the $100 placement fee, $40 of insurance and $10 for the card reader plan. An illustration, not a forecast.
| Bowling, Jul | Bowling, Dec | Park, Jan | Park, Jul | |
|---|---|---|---|---|
| Index | 93 | 105 | 82 | 120 |
| Servings that month | 280 | 314 | 246 | 360 |
| Take at $4.54 | $1,272 | $1,427 | $1,118 | $1,636 |
| After $150 fixed costs | $1,122 | $1,277 | $968 | $1,486 |
| Fixed costs as share of take | 11.8% | 10.5% | 13.4% | 9.2% |
On the same 3,600 servings a year, the park pattern moves the operator’s monthly take by about $520 between January and July; the bowling pattern moves it by about $150. Pairing the two evens things out: averaging the bowling and park indexes gives a peak-to-low swing of 16%, against 46% for the park pattern alone.
A venue that closes outright is a different case. A flat monthly fee keeps running unless the agreement pauses it, so read the term sheet before you sign a summer-only site.
Slow months are also the cheapest time for deep cleaning and repairs; our service schedule sets the cadence. The payback math uses the same $150 of fixed costs and shows how a weak quarter stretches the months to break even.
Our view: build the first route on venues that pay their way every month and pass the cotton candy vending machine location requirements, and add a summer venue second, once the year-round machines can carry it through February.
Which venues in the marketplace hold steady all year?
Most venues in the marketplace listings are indoor, so most cotton candy placements there avoid the deepest seasonal swings. Of the 80 open listings that specify a cotton candy machine, 49 are indoor family and activity venues, 18 are bowling alleys, 7 are retail, food or lodging sites, and 6 are summer-type venues such as parks and a campground.
| Season profile | Venue types in the listings | Cotton candy listings | Share |
|---|---|---|---|
| Winter-strong | Bowling alleys | 18 | 22.5% |
| Indoor family and activity | Playgrounds, FECs, trampoline parks, arcades, rinks, others | 49 | 61.3% |
| Retail, food and lodging | Retail stores, a gas station, a deli, food service, hotels | 7 | 8.8% |
| Summer-type | Amusement parks, water parks, mini golf, a campground | 6 | 7.5% |
The season profile is our classification by venue type (FECs are family entertainment centers), built from the October 5, 2026 snapshot of open listings. A venue’s own calendar can differ, so ask: the indoor group includes one haunted attraction, a venue type that often opens only around Halloween. Visitor counts in the listings are reported by the venues and not audited.
Hotels show how much a venue’s own calendar matters: family resorts track school holidays while business hotels stay flat, as the cotton candy machine hotel guide explains.
Frequently asked questions
Which months sell the most cotton candy from a vending machine?
It depends on the venue type. Payroll data suggests parks and pools are busiest from June through August, while bowling centers peak from December through March and hit their low in July.
Do cotton candy machines sell less in winter?
At outdoor and summer venues, yes: many close, and amusement park payrolls run about 27% lower in December through February than in summer. At bowling alleys the pattern flips, and winter is the busier season.
How do I adjust a seasonal venue’s visitor count?
Divide the annual visitor count by the days the venue is actually open, not by 365. A park reporting 260,000 visitors over a 100-day season averages about 2,600 a day while open and none the rest of the year.
Should I move a cotton candy machine between summer and winter venues?
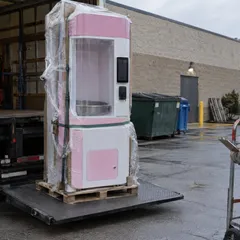
Moving a robot that weighs around 380 kilograms twice a year means freight, two installs and two venue agreements. Two machines on opposite seasonal patterns get most of the smoothing without the moves: the bowling and park indexes averaged together swing 16% instead of 46%.
Sources
- All employees, bowling centers, not seasonally adjusted (CEU7071395001), U.S. Bureau of Labor Statistics
- All employees, amusement parks and arcades, not seasonally adjusted (CEU7071310001), U.S. Bureau of Labor Statistics
- All employees, fitness and recreational sports centers, not seasonally adjusted (CEU7071394001), U.S. Bureau of Labor Statistics
- All employees, food services and drinking places, not seasonally adjusted (CEU7072200001), U.S. Bureau of Labor Statistics
- NAICS 713940: Fitness and Recreational Sports Centers, U.S. Census Bureau
- “Back to school” means anytime from late July to after Labor Day, Pew Research Center (Aug. 25, 2023)
- Cotton Candy Robot specifications, Sweet Robo
- How to Make Cotton Candy in a Commercial Machine, Gold Medal Products
- Dew Point vs Humidity, National Weather Service
- FDA Food Code 2026, U.S. Food and Drug Administration